
A Short Study
Background
What we did is just a short note to explain a little bit of research that has been done recently on the link between Thames flow rates and Hurley gate setting. The intention is to give us all a little bit more information about the likely setting of Hurley gates, if they are about to open, how long they might stay open and if they are about to close.
This work came about as a result of a short post by Dave/Scout on the TVF site, prior to this post Sam Anderson had shown us a link to Maidenhead Rowing Club that appeared to show daily readouts of Thames flow rates. A quick e-mail follow up with the guys at MRC confirmed that yes they did get real flow rate data from the EA on an almost daily basis and that this was used to populate their site feed. (We also checked out the possibilities of an auto feed but this is not possible at the moment so currently relies on an e-mail from the EA)
What we did
Next step was to take the data on flow rate and compare it with what we knew about Hurley gate settings to see if we can make a sensible correlation between a given flow rate and a given Hurley gate setting.
We therefore got the past years worth of daily flow rate data from MRC and also the past years worth of text updates to TVF on the gate status from Gareth. A short amount of number crunching via Excel produced the following chart:-
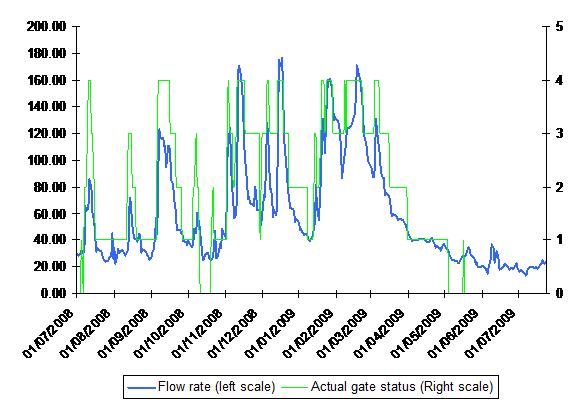
Fig. 1 Thames River flow rate (Cumecs) and Hurley Gate status – July 08-July 09.
Not surprisingly, the data clearly shows a strong link between higher flows and higher numbers of gates open at Hurley. So the next step was to look in more detail at the data to see if the “trigger point” for gates opening and closing was consistent. i.e. do the gates always open/close at a given flow rate and if so what is it?
Again using the data for the last year we created a model of gate opening levels and used this to predict the gate level and then compared it to the actual gate status. The final model data that gave the best match between predicted and actual gate settings is given in the table below:-
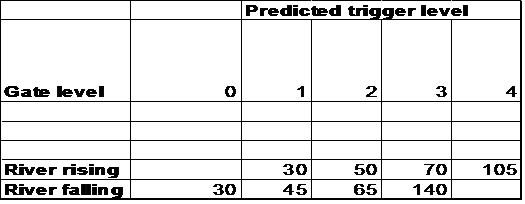
Fig. 2 – Hurley Gate predicting model for Thames flow rates. (July 09)
This shows the river flow rate (in Cumecs) needed to either open a gate (river rising) or close a gate (river falling). So for example the model predicts that as the river rises from 29 to over 30 Cumecs 1 gate at Hurley will open, if it rises further to 50 Cumecs 2 gates will open and at 70 Cumecs we get to 3 gates etc. On the way down though 3 gates will remain until the rate drops below 65 cumecs and similarly 2 gates holds until we get down to 45 cumecs etc.
Accuracy.
The model above proved remarkably accurate at predicting the change point for Hurley gates, and 70% of the time it got the gate change and the time/date right i.e. model predicted change date was the same as the actual change date. Most of the errors were where the model predicted gates should close and they held open for a few days longer. This was particularly prevalent after a good spell of 2 and 3 gates. We suspect this is a result of Giles (the Locky) doing his best to prolong the fun! Other general errors appear when the river rises very quickly and we go from 1 to 2 to 3 and even 4 gates over a very short period. In these cases the gate opening tends to happen slightly earlier than the model predicts. We suspect this is due to the Lock keepers being cautious and opening up gates early to prevent any build up of big flows above the weir. Generally though, these errors result in the model being no more than 1 day out with its change prediction.
Summary
The modelling work appears to show that there is a very strong correlation between measured flow rate on the Thames and Hurley gate positions. Knowing the measured flow rate enables you to say with a high degree of certainty what gate setting Hurley will be on, and by tracking trends in flow rate if it is likely to change either up or down in the near future. In short, if you want to know what Hurley is or will be on go to the MRC site check the flow rate and then look it up on the table in fig 2 above. Until we get a web cam on the weir this is probably the best predictor we will get.
Acknowledgements.
Modelling work done by Garry and Ciaran Miller with thanks to Gareth, Sam and Dave/Scout for tracking down the data in the first place. Any questions about this model then PM Garry or post on the TVF site and we will try and answer them.